Friday, July 31, 2009

Regression Equation

In conclusion, with the usage of the Anova Coefficients feature, we can come up with the Regression Line Equation.


Palm length = 0.132 (Height) -4.152

With this equation, we can compute out either the height or the palm length with a known variable, thus further confirming with the correlation we have done in an earlier post.

Generation of Scatter Plot

The levels of measurement for palm length and height are both scale as there is an equal rate of increment (like 0.1cm increment for palm length and 0.5cm increment for height) and there is no absolute zero value.

With the usage of SPSS program, we generated a scatter plot, using the Pearson’s R test, as follows;


From the Scatter Plot generated, we can gather that there is a positive correlation between the palm length and the height with a R Sq Value of 0.486.

Collection of Data

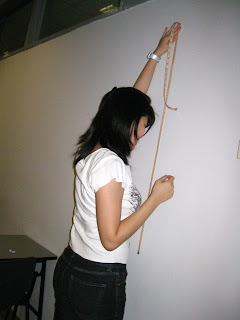
Here are pictures that showed the actual progress of data collection.
The Set Up for measurement of height
Measurement of Height
Measurement of palm length


For the measurement of the palm length, we standardised it will be measuring from the base of the palm to the tip of the middle finger (which is usually the longest finger). The instrument for measurement was a standard measuring tape. We decided to adhere to the 0.1 cm increment for consistency and accuracy of the data collected.

For the measurement of the height, we standardised it will be measuring from the base of the heel to the top of the head. The instrument for measurement was a standard measuring tape. We decided to adhere to the 0.5 cm increment for consistency and accuracy of the data collected.

To further rule out any other inconsistency, we made sure to record the readings with our eye level directly perpendicular to the measuring tape, to minimise any chance of parallax error.

This process was repeated 3 times for ruling out any anomaly and for greater accuracy and consistency.

The following table shows the 3 sets of data and the averaged readings of the palm length and the height.


Thursday, July 30, 2009

Tabulation Using Pearson's R

The following is the table we generated using the Pearson’s R function.


From the table above, the R value is 0.696, signifying a moderate to high relationship of the palm length to the height. (R Value = 0.696, n=30)

Going back to the Null Hypothesis we constructed earlier - There is no significant correlation between the individual's palm length and the individual's height.

Therefore, to conclude the Null Hypothesis, we can now say that there is a significant correlation between the individual's palm length and the individual's height. The Null Hypothesis is rightfully rejected.

Thus, this result supported our research hypothesis - There is a significant correlation between the individual's palm length and the individual's height. We have failed to reject the research hypothesis. The research hypothesis holds truth.

Our Null Hypothesis

We propose the following null hypothesis;

Null Hypothesis (H0) : There is no significant correlation between the individual's palm length and the individual's height.

Firstly, the collection of the data was done in the following manner:
  • The target of population were students from NYP.
  • The students were aged 18 to 24.
  • The participants were selected by accidental sampling within the school compound.
  • The participants were selected regardless of race.
  • The participants were not suffering from any significant psychical deformities.
  • 30 sets of data were collected in total.
  • 3 rounds of data collection were done.
  • The average of the 3 rounds of data (for both palm length and height) were taken as the final reading.

Friday, July 17, 2009

Welcome!

This is a website for our inquisitive needs in finding out whether the length of the human palm correlates to the height of that particular individual, which was linked to a theory called The Golden Ratio.

Complete with actual measurements of live specimens and our professional (I think!) statistical findings, we shall find out whether The Golden Ratio holds concrete evidence!


Let our statistical and investigative journey begin!


The team of numerically sensitive statisticians,
Adele, Clare, Ee Ling, Ling Xuan and lastly Samantha.